Discussion Point:
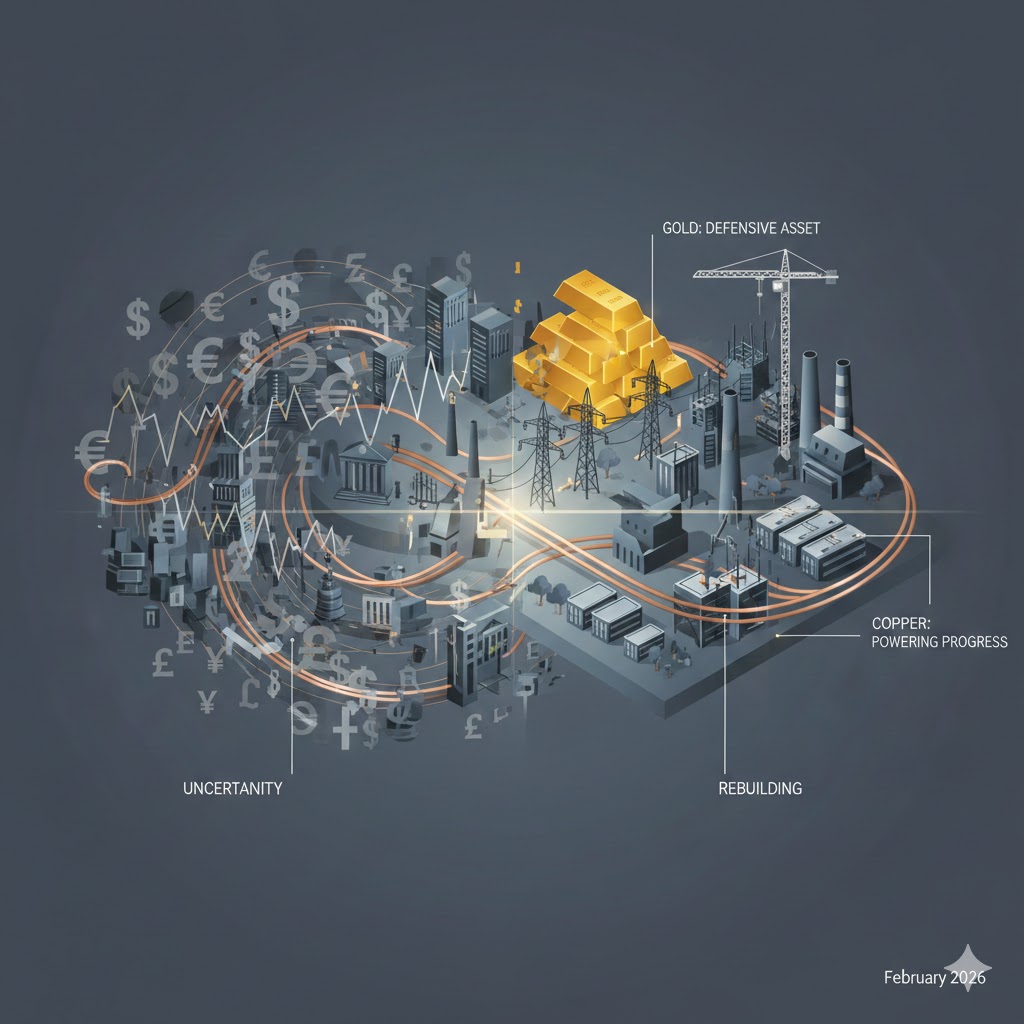
Wars create short-term uncertainty and volatility, but history shows that the real investment opportunity lies in the policy response particularly how energy shocks force structural reforms, infrastructure spending, and sector rotation.
War always dominates the headlines. It shapes global policy and forces volatility into every chart we watch. But if you’ve spent enough time in this industry, you know that markets aren’t actually reacting to the war itself, they are reacting to uncertainty. That distinction is everything. In this business, we know that capital doesn’t disappear; it just moves. Understanding where it moves, and why, is the difference between panic and positioning.
The ongoing tensions between the United States and Iran have once again pushed energy markets into focus. Even before any full-scale escalation, oil prices are already pricing in risk, with Brent crude moving higher on expectations of potential supply disruptions from the Middle East.
What is important here is not just the price movement, but the response it triggers. Countries will begin to reassess energy security, supply chains, and prepare for higher spending in critical sectors.
The Three Phases of Conflict
Every modern conflict tends to follow a predictable psychological and market pattern.
The Flight to Safety (Fear):
At the first sign of conflict, risk is reduced. Equities sell off, and capital rotates into safe-haven assets such as gold and the US dollar. This pattern was clearly visible during the Russia–Ukraine War, when global equities declined in Q1 2022 while energy and commodity prices surged. According to the International Monetary Fund, periods of heightened geopolitical risk are typically associated with capital flight to safe assets and increased market volatility.
The Adjustment (Reality):
Panic selling rarely lasts. Markets operate on probability, expectations, and profit margins. As uncertainty begins to narrow, capital is redeployed toward sectors that are directly exposed to the new environment. This transition has been observed across multiple conflicts, including the Iraq War. Empirical work by Cieslak and Pflueger (2023) also supports this, noting that market reactions depend heavily on how uncertainty evolves rather than the event itself.
The Structural Shift (Opportunity):
This is where long-term capital is deployed. War forces governments and corporations to change how they spend, produce, and secure resources. According to the World Bank, post-conflict environments are typically characterized by increased public spending, infrastructure rebuilding, and structural investment shifts that persist beyond the conflict period.
What War Actually Changes: The Sector Pivot
War does not affect the economy evenly. Instead, it compresses long-term structural changes into shorter timeframes, creating what can be described as a sector pivot. This aligns with observations from the International Monetary Fund and the World Bank, which note that geopolitical shocks tend to accelerate structural shifts in production, investment, and sectoral allocation through spending.
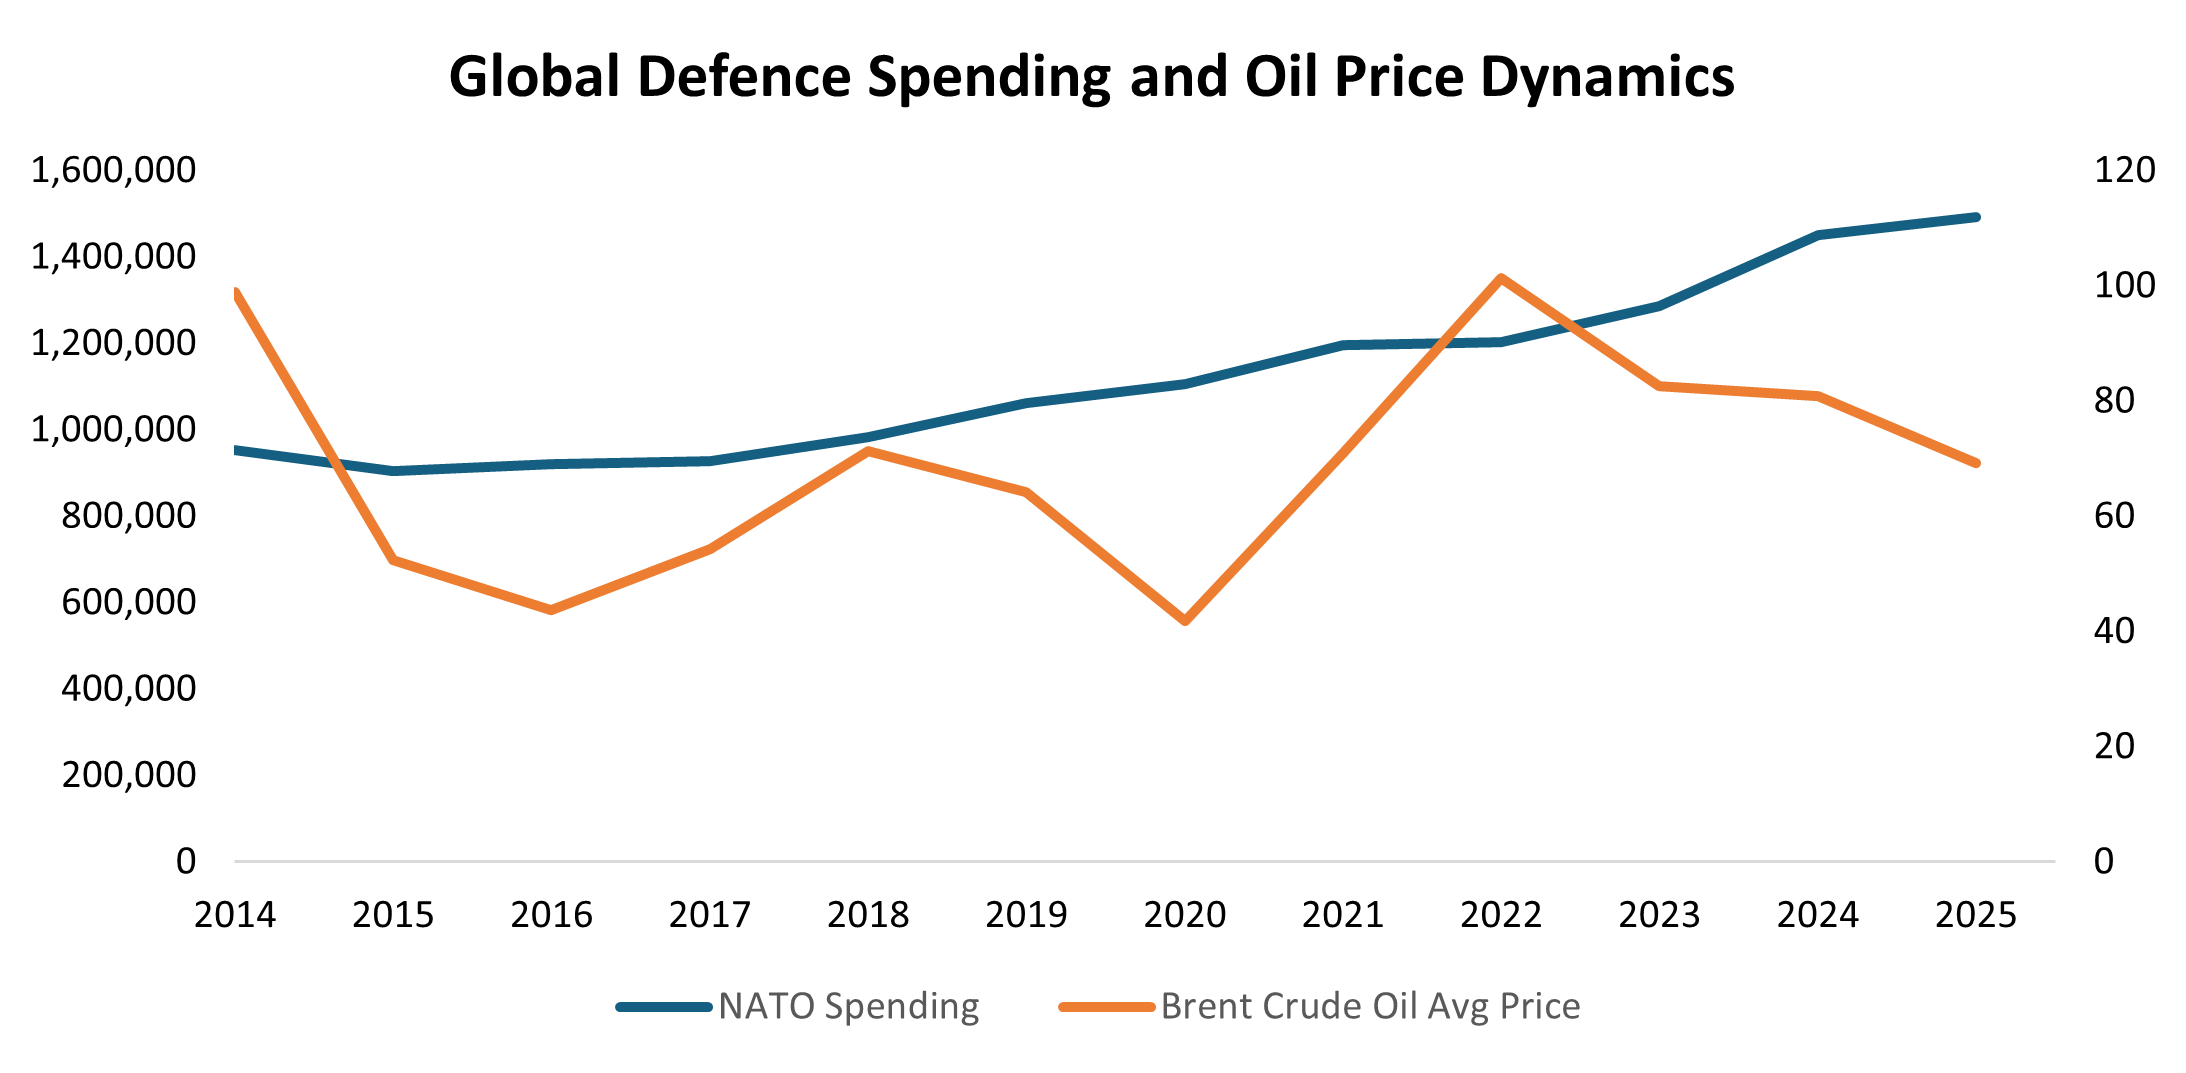
Source: Bloomberg, SPH Equities Trading Desk
In the chart above, the divergence is clear. Brent crude prices are volatile and react sharply to conflict events, particularly in 2022 and even in February-March this year, when prices moved from around $70 to over $120 per barrel. In contrast, NATO defence spending shows a steady and structural upward trend. According to NATO data, defence spending increased materially after 2022, with countries such as Germany committing over €100 billion in additional funding.
The implication is straightforward: energy is reactive, while defence and infrastructure are structural.
Energy, in particular, shifts from being a traded commodity to a strategic asset. During the Russia–Ukraine war, the sharp increase in oil prices reflected supply risks from one of the world’s largest exporters. According to the International Energy Agency, geopolitical tensions significantly increase the strategic importance of energy security, leading to sustained investment in domestic production and alternative energy systems. At the same time, supply chains are disrupted. During the Arab Spring, oil prices rose above $110 per barrel, and global trade flows were significantly affected. The World Trade Organization notes that such disruptions often lead to long-term adjustments in sourcing, logistics infrastructure, and trade routes.
Bringing it Home: The Nigerian Transmission Mechanism
Nigeria is not directly involved in these conflicts, but the impact is transmitted through one primary channel—oil. When global crude prices rise, government revenues improve. At the same time, higher energy costs feed directly into transportation and production, creating inflationary pressure across the economy.
This dynamic consistently exposes Nigeria’s structural dependence on imported energy. Policy response has typically followed quickly. For instance, the 2026 budget is N68.32 trillion, of which 47% is allocated to capital expenditure (N32.2 trillion), also the move toward FX unification, and the renewed push for domestic refining capacity through the Dangote Refinery and refinery rehabilitation programs all reflect an attempt to reduce fiscal pressure, improve supply stability, and limit external vulnerability.
In essence, external shocks force adjustment. Over time, this drives a shift toward energy self-sufficiency, infrastructure investment, and reduced import dependence. For investors in the Nigerian Market, the opportunity lies in understanding how these adjustments translate into earnings
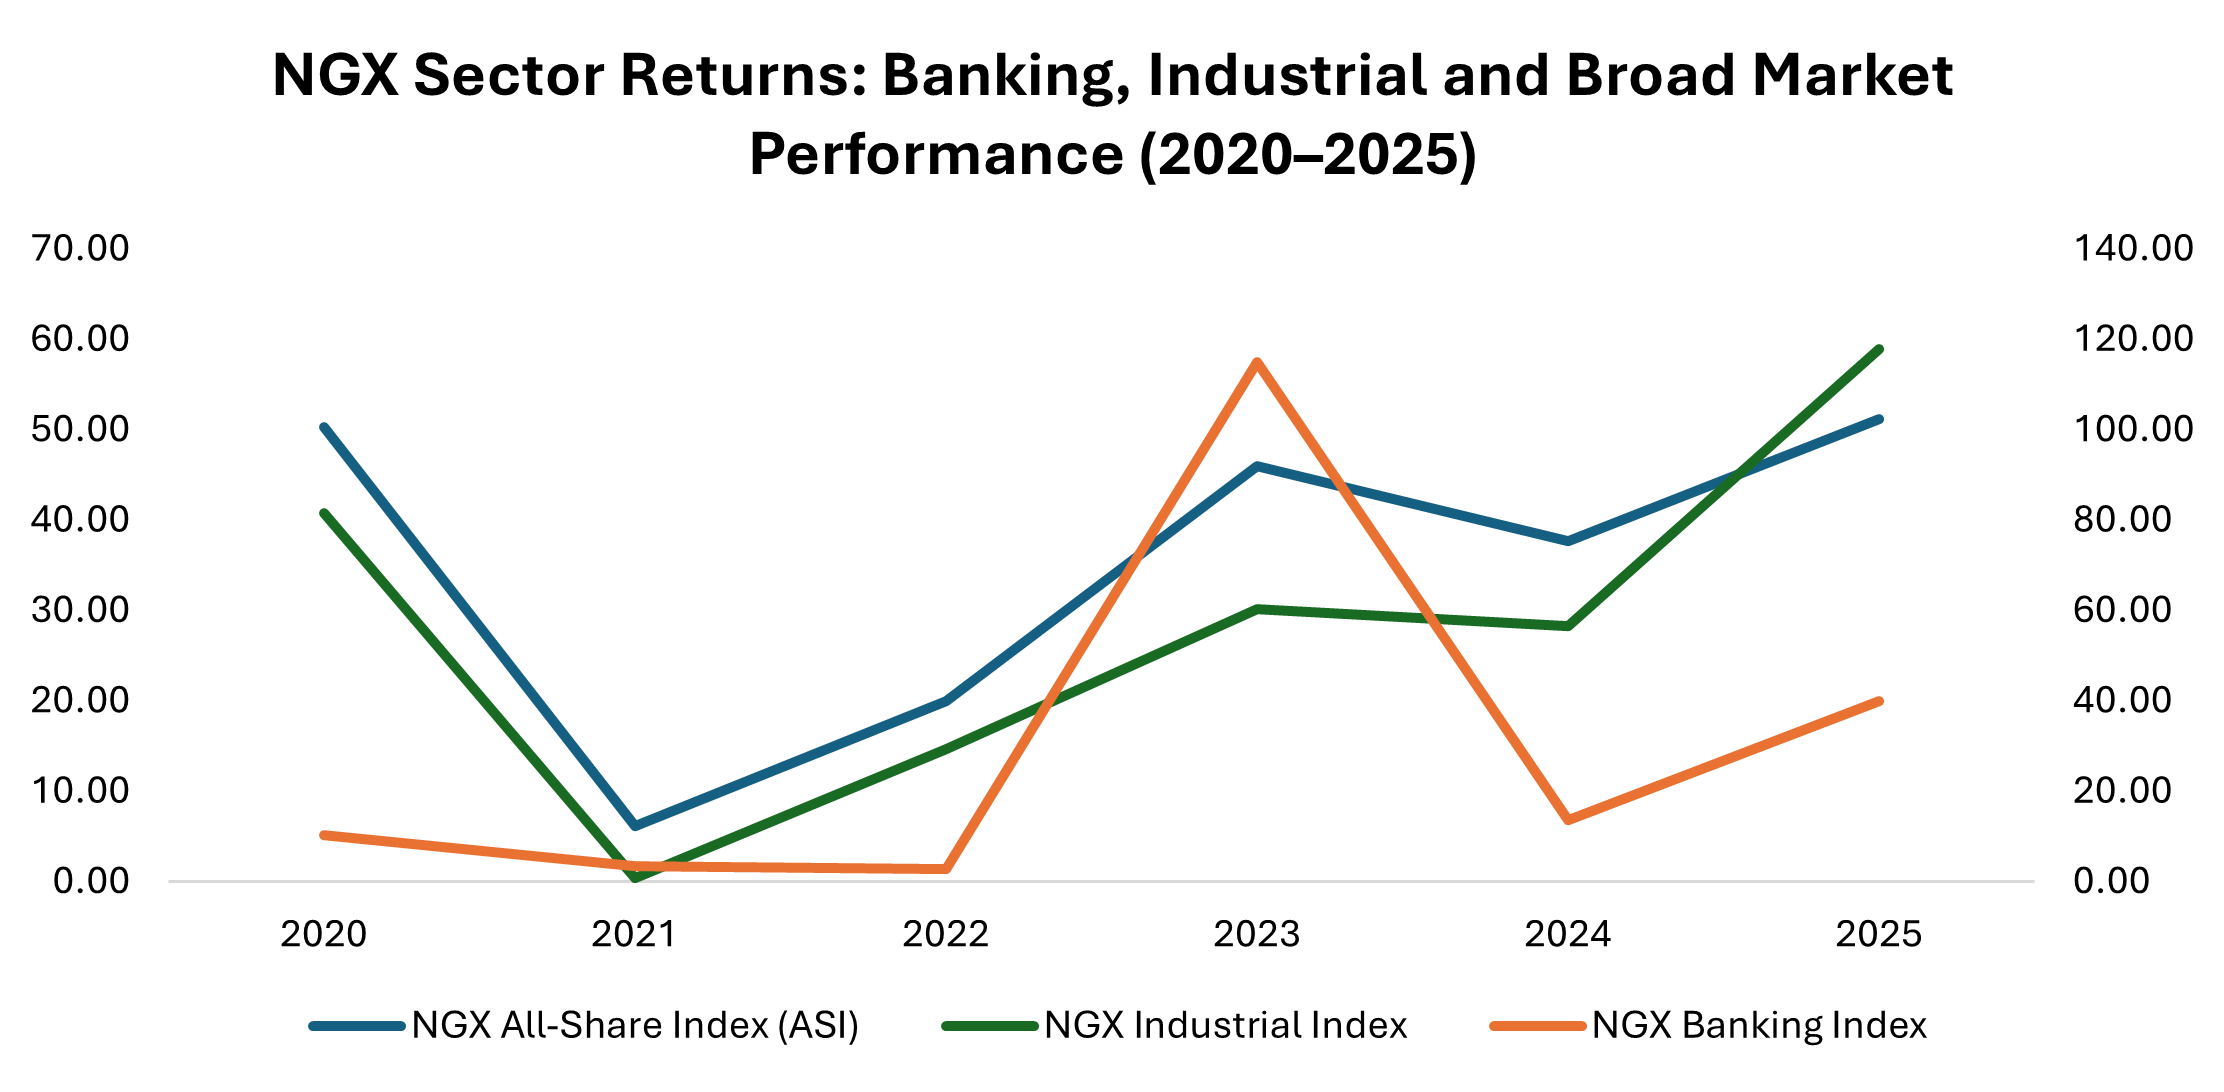
Source: Investing.com, SPH Equities Trading Desk
The shift between sectors is clear. In 2023, the NGX Banking Index outperformed significantly, driven by FX revaluation gains following exchange-rate adjustments. However, by 2025, the Industrial Index begins to take the lead, reflecting a transition from financial adjustment to physical execution. Although Oil & Gas is currently leading the index, it is expected to revert to industrials.
This pattern aligns with broader observations by the Central Bank of Nigeria, where periods of FX adjustment are often followed by shifts toward real sector investment and infrastructure spending.
As macro conditions stabilize, capital rotates toward infrastructure and industrial names such as as Lafarge, Dangote Cement, BUA Cement, and Julius Berger, which benefit directly from increased project execution. Energy-linked companies, including Seplat Energy, Aradel remain exposed to the pricing environment and sector activity. However, banks such as GTCO, Zenith Bank, and Access Holdings typically respond first to improved liquidity conditions.
However, the opportunity is selective. because firms with high import dependence and FX exposure tend to face margin pressure during periods of cost inflation.
Final Thought
Most investors get stuck in the first phase: fear. They react to headlines and uncertainty. But the data tells a different story. The real gains are made in the second and third phases (adjustment and opportunity). War forces systems to correct their weaknesses. It redirects capital, reshapes policy, and creates new demand.
History shows that the biggest winners are not those who react to conflict, but those who understand how economies rebuild after it.
Kindly find the Report Below
Thanks for reading.